
Ambisonics
Since version 2016.1, Wwise has supported ambisonic channel formats for busses. Wwise takes care of encoding (mixing a non-ambisonic signal to an ambisonic bus) and decoding (mixing an ambisonic signal to a non-ambisonic bus). This allows users to mix multiple sounds in the environment to an ambisonics bus, and then convert that ambisonics bus to binaural using a 3D audio plug-in such as Auro Headphone. Users can also export the ambisonic audio directly by using the Wwise Recorder Effect on an ambisonics bus.
Displaying Ambisonics
One of the major benefits of the ambisonics channel format is that it is speaker-setup-agnostic. Through the process of decoding, it can be targeted to various types of speaker setups. This also allows the sound field to be easily rotated with the listener. However, this also introduces a challenge in how to display the audio data meaningfully, in a user interface setting. In an ambisonic channel format, each channel relates to a specific 'spherical harmonic' in the sound field. What this means is that the meter data for a channel determines the sound level at multiple points in space. This makes it almost impossible to understand the spatial information conveyed in an ambisonics channel configuration just by observing the channel meters alone. Instead, the encoded ambisonic signal (represented by the channel information) must first be decoded to a specific speaker setup, such that the levels at each speaker in the target setup can be inspected. This kind of technique has been used previously by Kronlachner and Zotter (2014) and Lecomte and Gauthier (2015).
When decoding an ambisonic signal to a target speaker setup, the spatial accuracy of the reconstructed sound field is affected by the distribution of the loudspeakers (Trevino et al., 2010). Specifically, the extent to which each direction is equally sampled by the speaker setup can simplify (or complicate) the decoding process. In order to display meaningful spatial information from an ambisonic channel configuration we must first decode the data to a specific virtual speaker setup, and then use that virtual speaker setup to display the spatialized data. This is the method used by the 3D Meter in order to display the spatialized ambisonic data.
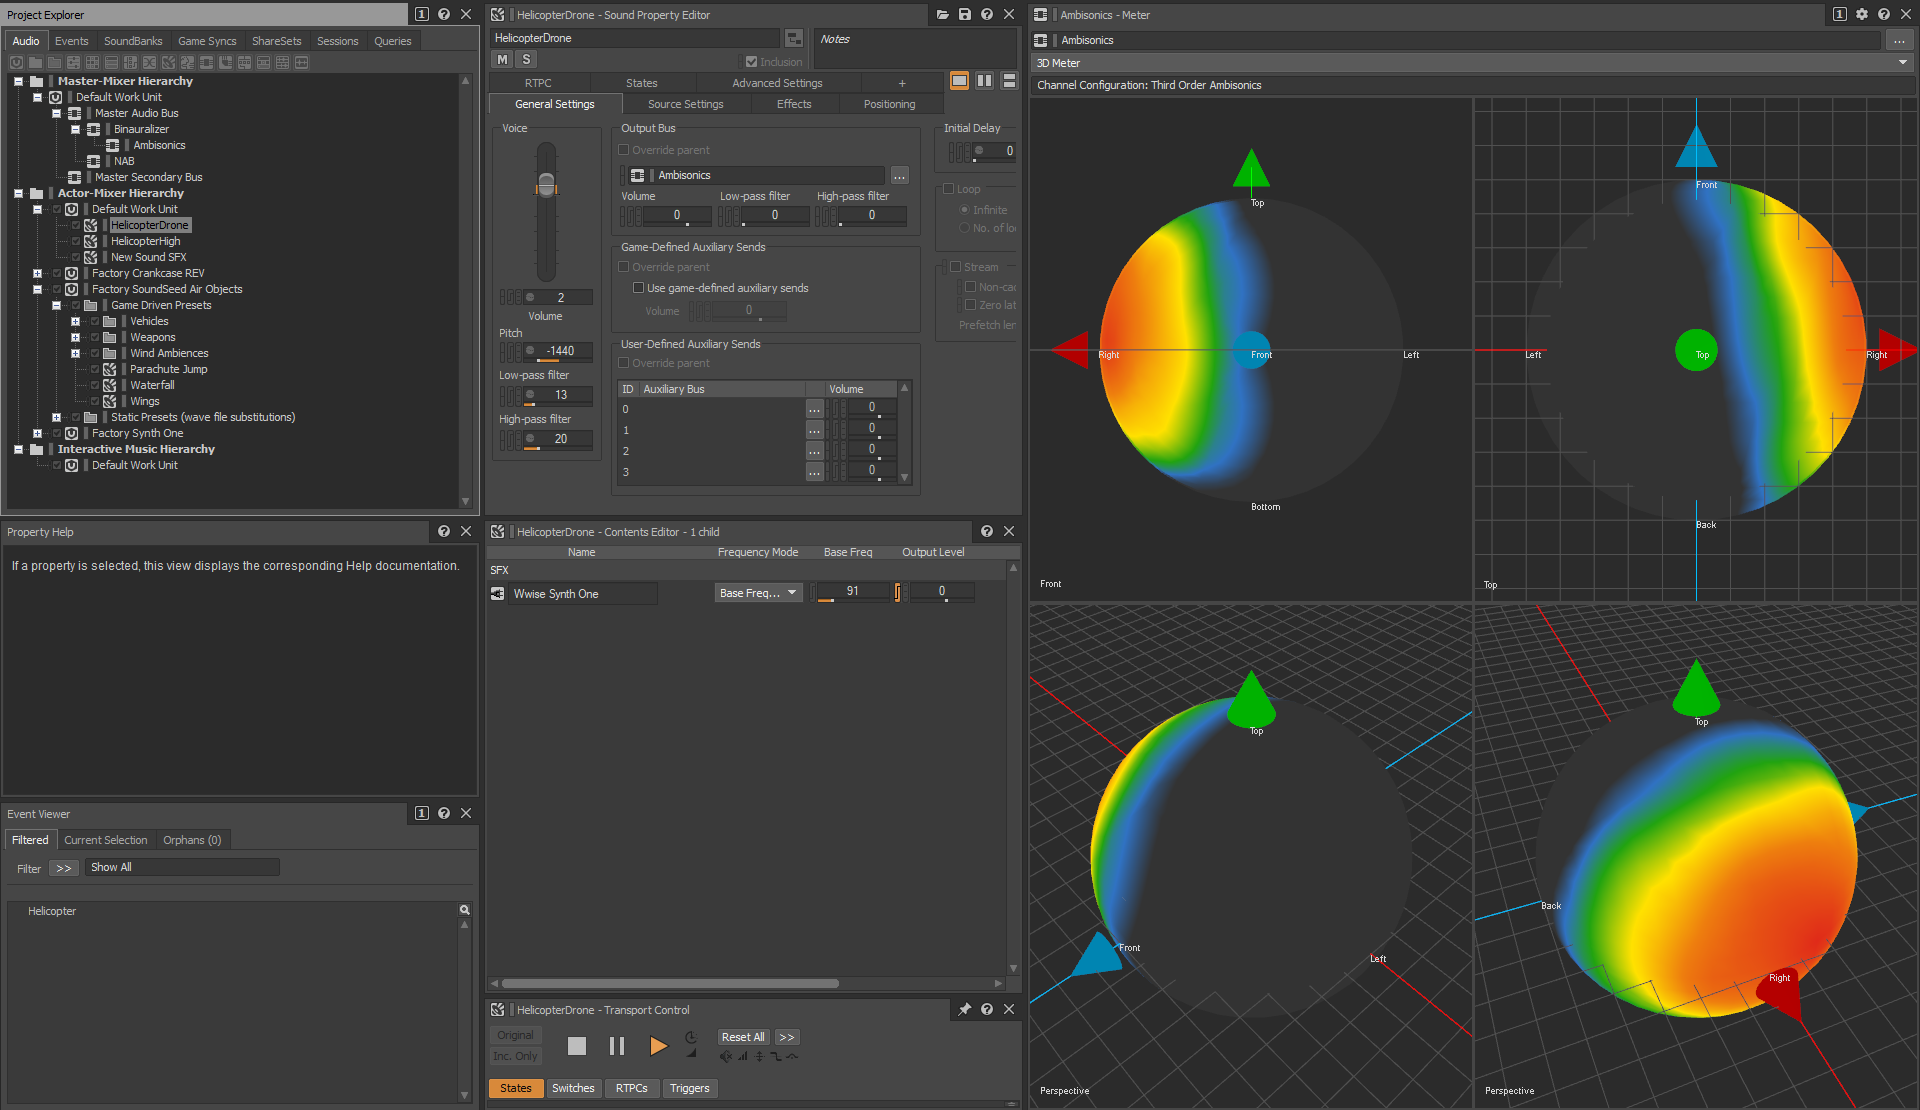
The 3D Meter
The 3D Meter provides a way of visualizing the directional information in an ambisonics bus. It presents the audio data as a spherical heatmap, by decoding the ambisonic channel data onto virtual speaker positions around a sphere in the local bus space (as mentioned above). These virtual speakers are then individually metered, and the levels at each speaker are used to construct the smoothed heatmap. The speaker levels are sent to a custom pixel shader, which is used to render a sphere. Each pixel in the sphere is colored according to its proximity to each virtual speaker position around the surface of the sphere and the levels at each position. The 3D Meter, therefore, allows users to inspect the directional information contained in an ambisonics bus and how it is affected by the sources distributed around the listener. There are four individual panels in the 3D Meter that can each be used to view the sound field from a different perspective. Six fixed orthographic viewpoints are available (top & bottom, front & back, left & right), as well as the perspective viewpoint, which can be rotated around the sound field by clicking & dragging. All viewpoints can also be zoomed using the mouse wheel.
The 3D Meter also provides a good way of comparing the spatial resolution of different ambisonics channel formats. The examples below compare the spatial resolution of first-order, second-order, and third-order ambisonics busses. In each example, the same two sources are mixed into the bus; one panned to front center, and one panned to rear center. It can be seen that third-order ambisonics provides more accurate spatial localization of the individual sources, whereas with lower-order ambisonics formats they become blended together. In the examples below, the viewpoints are set up as follows: top-left panel—back; top-right panel—front; bottom-left panel—top; bottom-right panel—perspective.
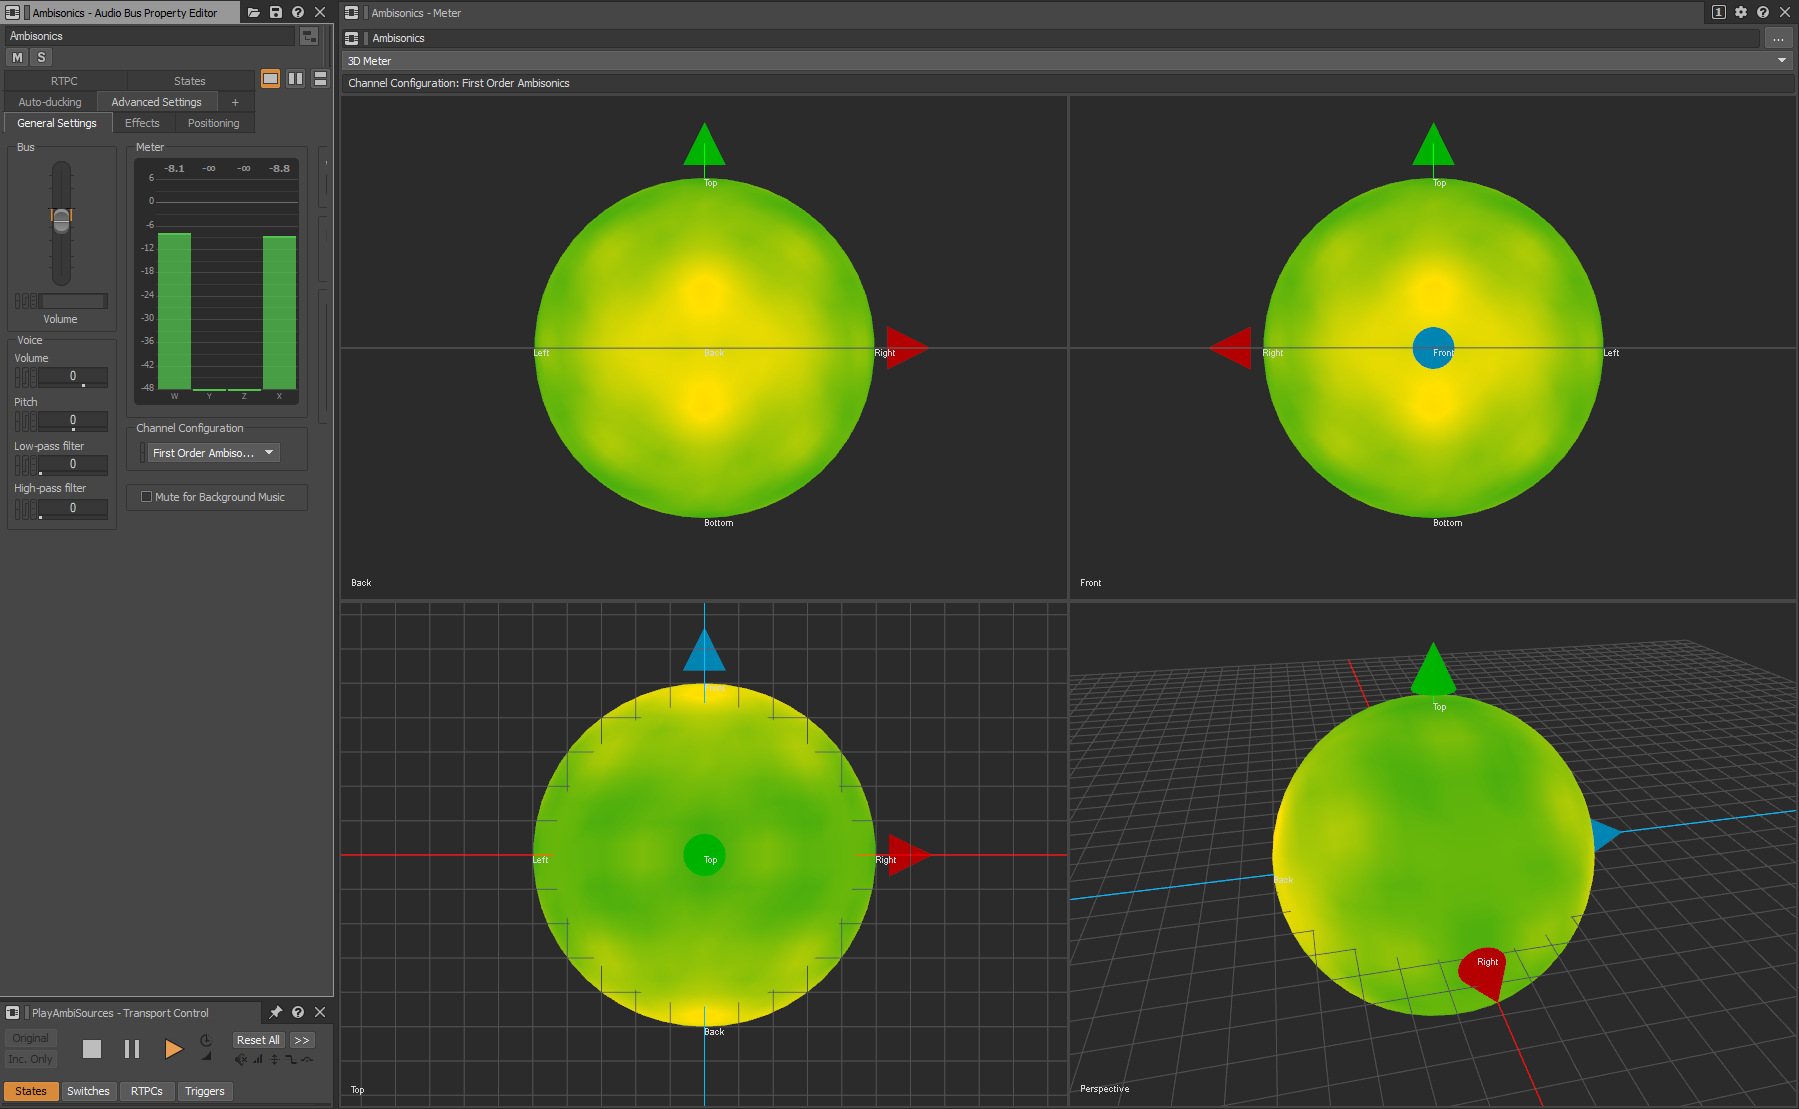
Front and back sources mixed into first-order ambisonics bus
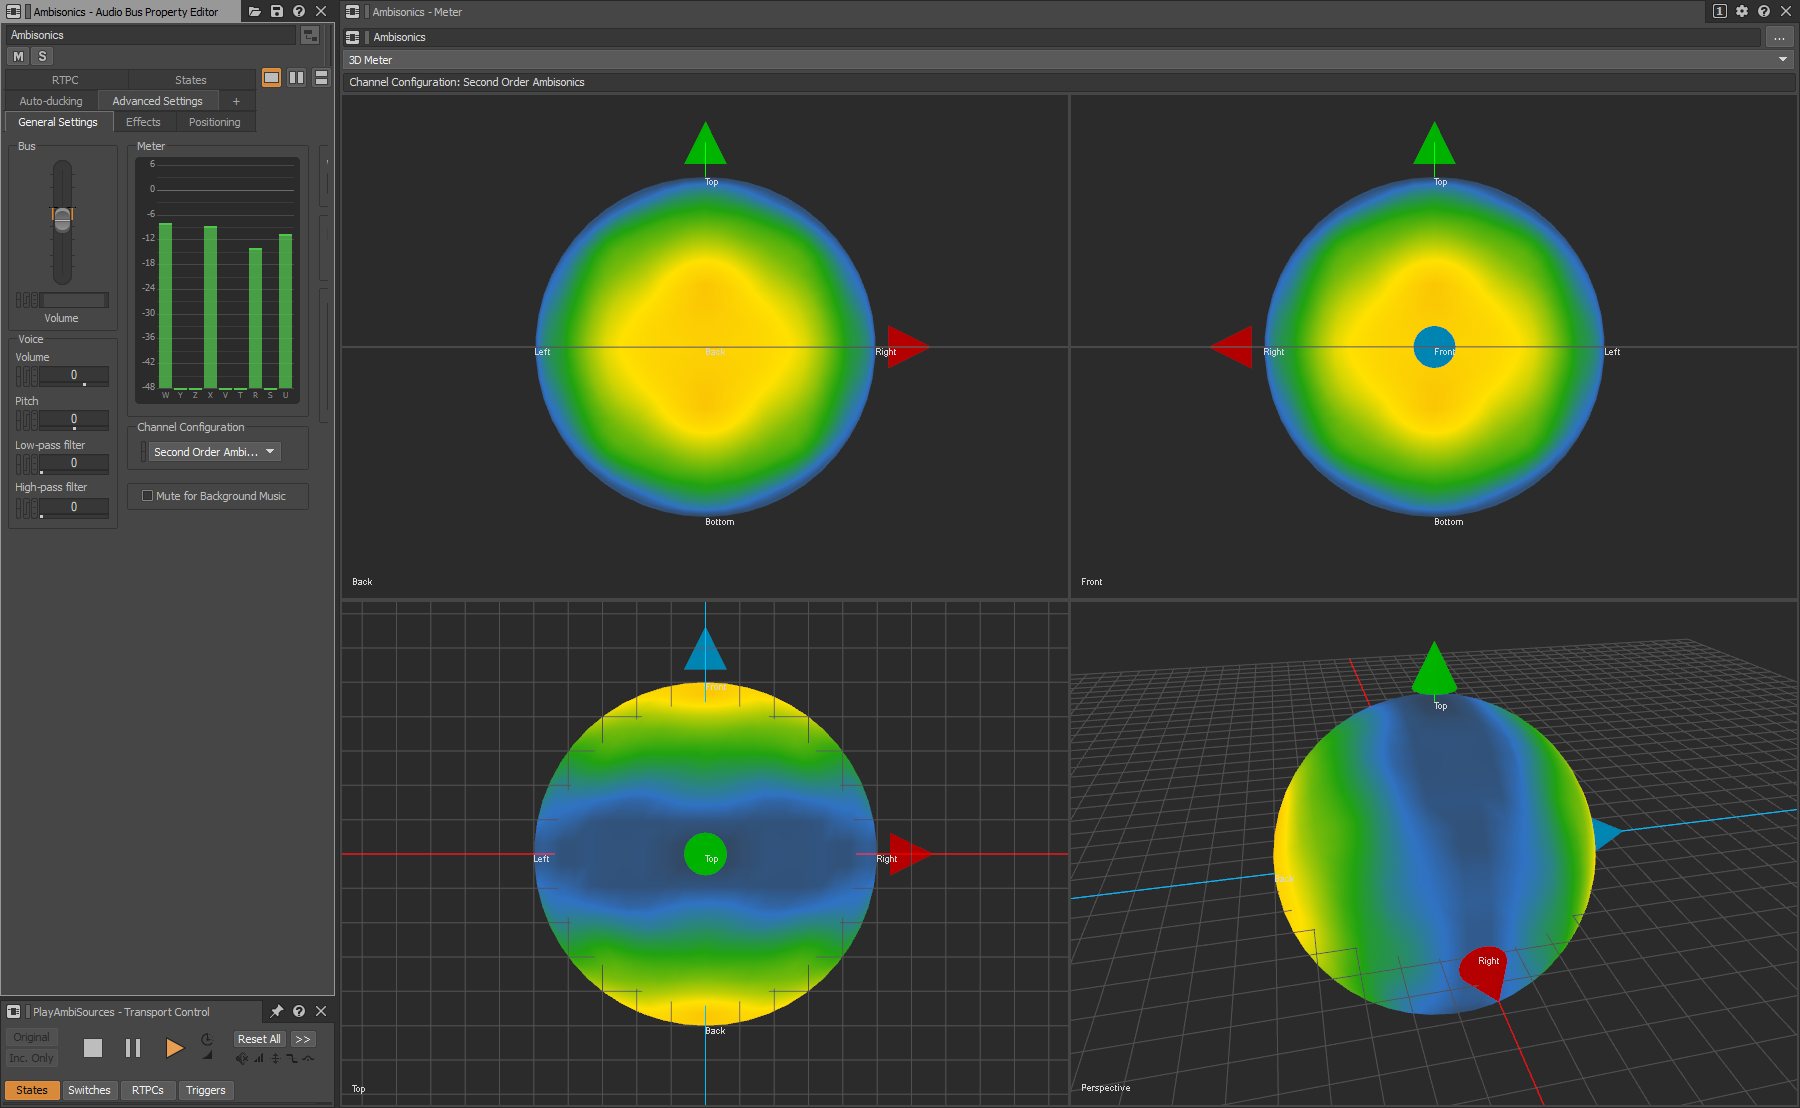
Front and back sources mixed into second-order ambisonics bus
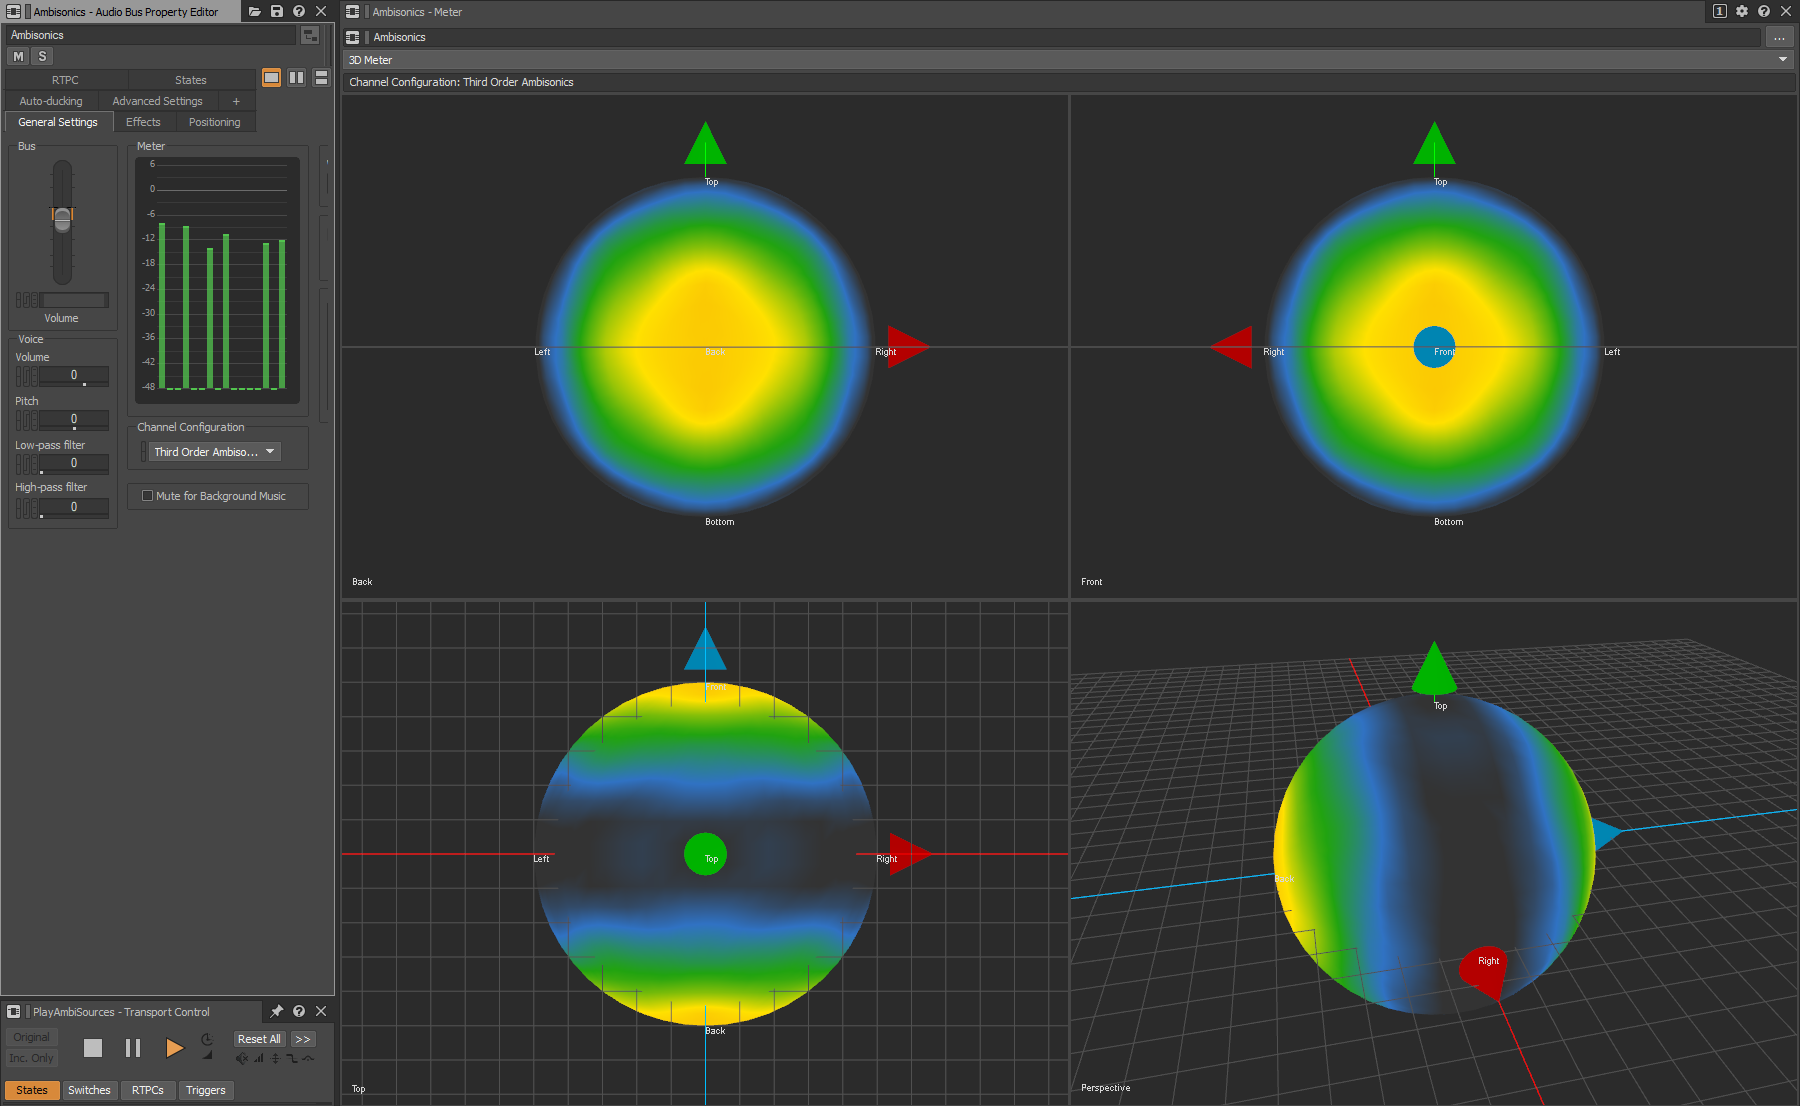
Front and back sources mixed into third-order ambisonics bus
Color Mapping
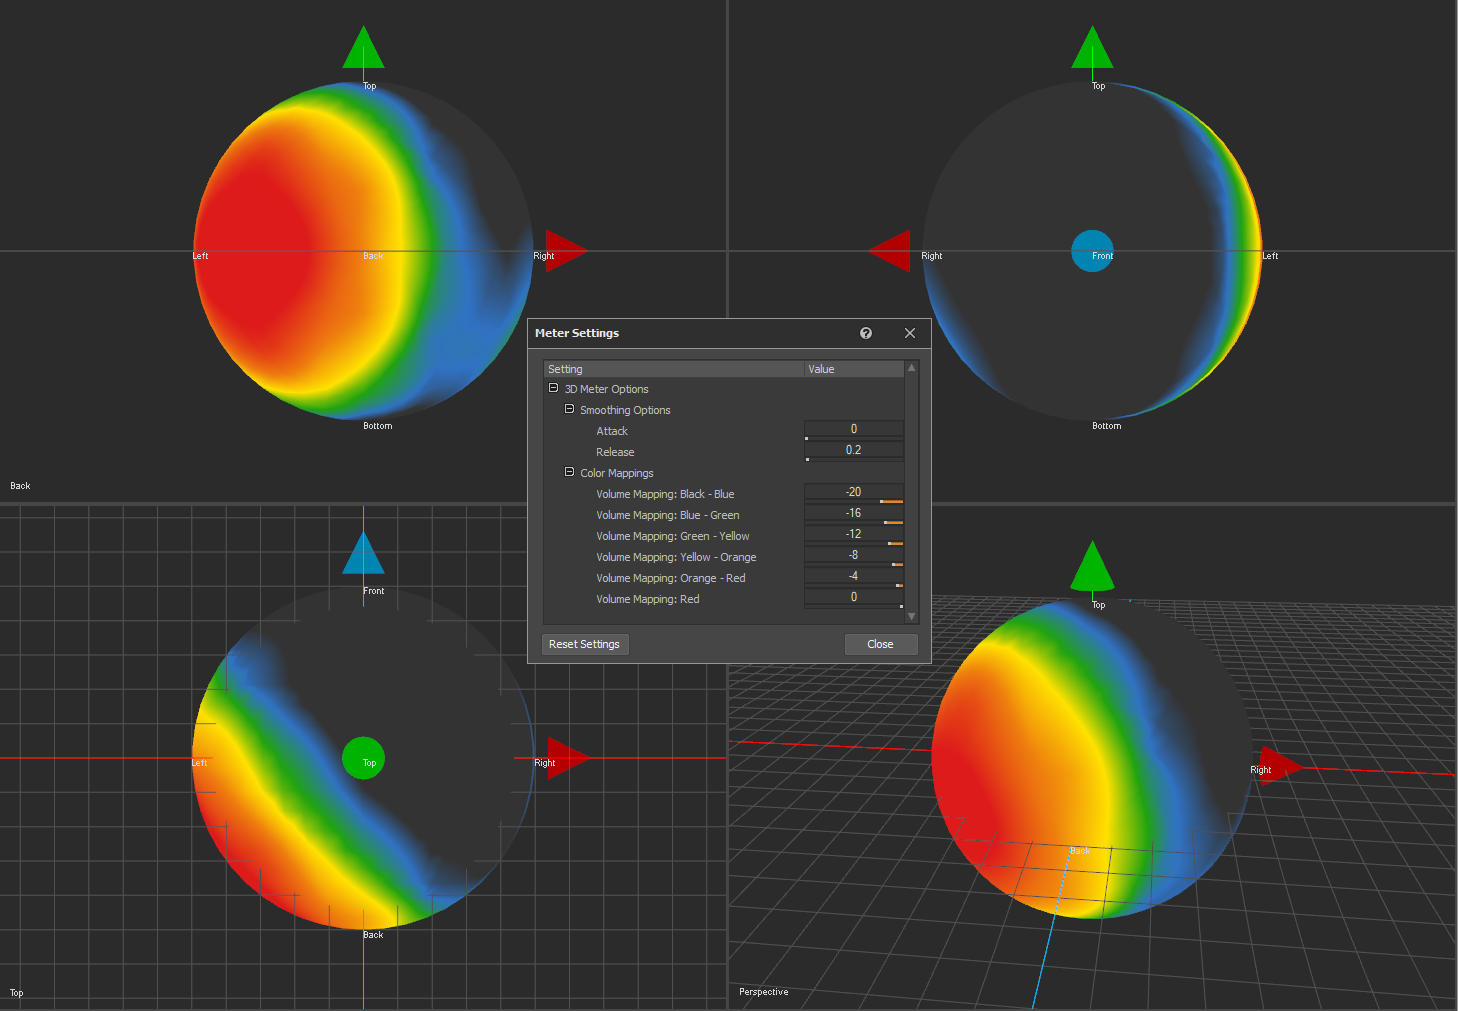
The colors of the heatmap are used to indicate different dB ranges, and these mappings are configurable in the Meter Settings window. In the settings window, the dB threshold for a color indicates the beginning of the gradient between that color and the next. So, in the example below, the meter will blend between black and blue over the range of -20 dB to -16 dB. It will then blend between blue and green over the range of -16 dB to -12 dB, and so on.
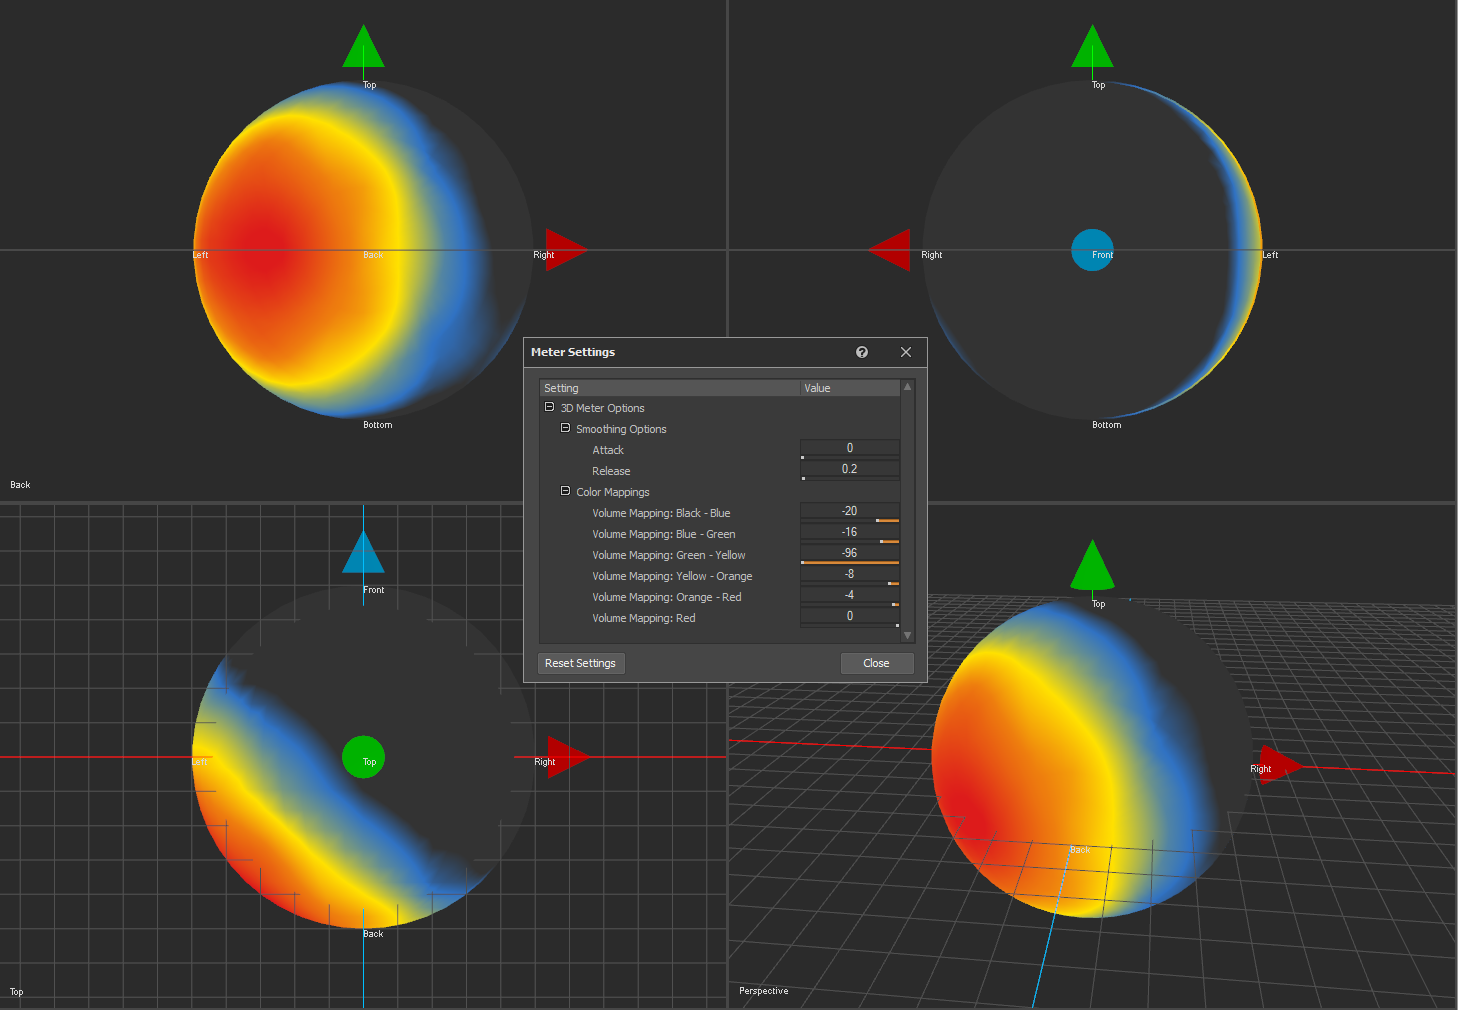
In order to exclude a color from the meter, its dB threshold can be set to lower than any of the thresholds preceding it. In the below example, green is excluded from the color map displayed on the meter.
Smoothing
The 3D Meter implements smoothing when metering the virtual speaker positions around the sphere. This smoothing works in the same way as the Meter plug-in Effect. The attack value determines the time it takes for the display value to rise by 10 dB and the release value determines the time it takes for the display value to fall by 10 dB. Note that if a Meter plug-in Effect is used on a single source, before it is mixed into an ambisonics bus, the meter values on the Meter Effect for the source will not match those displayed on the 3D Meter for the ambisonics bus. This is due to gain factors that are applied during the ambisonics decoding process. When the original source is metered it is metered directly, without any spatialization. When it is mixed to an ambisonic signal, the source is spatialized and 'moved' to some point a fixed distance away from the listener. Therefore, when the ambisonic signal is decoded and metered, the original source's level within the ambisonic sound field will be lower than when metered individually. The example below features a choppy helicopter sound moving around the listener position in a circle. As the release value is decreased, the meter reacts to changes in level more quickly, causing more rapid change in display. As the release value is increased, the meter values are smoothed out.
References
-
Kronlachner, M. and Zotter, F., 2014, February. Spatial transformations for the enhancement of Ambisonic recordings. In Proceedings of the 2nd International Conference on Spatial Audio, Erlangen.
-
Lecomte, P. and Gauthier, P.A., 2015, November. Real-time 3D ambisonics using FAUST, processing, pure data, and OSC. In 15th International Conference on Digital Audio Effects (DAFx-15), Trondheim.
-
Trevino, J., Okamoto, T., Iwaya, Y. and Suzuki, Y., 2010, August. High order Ambisonic decoding method for irregular loudspeaker arrays. In Proceedings of 20th International Congress on Acoustics (pp. 23-27).
.png)
Comments